
Ask in plain language
Get answers to business questions without searching through menus or building reports.

SOLUTIONS | AI-POWERED ANALYTICS
With AI-powered analytics, ask questions in plain language and get insights from your asset, ticketing and usage data across locations, helping you identify issues and make better decisions.
The challenge
Understanding performance across locations often means switching between reports, applying filters and combining spreadsheets. That takes time away from improving operations.
D-Fetch AI-powered analytics lets you ask questions directly across asset, ticketing, usage and routine data, so your team can spend less time analysing and more time acting.
What you can do
Get answers to business questions without searching through menus or building reports.
Bring asset, ticketing, usage and routine data together to understand what affects performance.
Compare sites and departments to identify differences and see where attention is needed.
View answers as charts and comparisons to understand changes over time and share findings.
Real questions
Performance
“Which club is underperforming compared to the others?”
Ticketing
“Which club has the most open tickets right now?”
Downtime
“Which equipment has had the most downtime in the last 90 days?”
Utilisation
“Which assets are hardly used and could be moved to another site?”
Lifecycle
“Which treadmills are closest to end of life?”
Routines
“Which locations missed their daily checks last week?”
Month to month
“How did downtime this month compare to last month, per club?”
Reports
“Make a chart of open tickets per club for my monthly report.”
Trends
“Show utilisation per site for the last six months.”
How it works
Ask about your operations in plain language.
Relevant data from your platform is brought together.
Understand what’s happening and where to focus.
Look closer at the data behind the answer.
Use the insights to improve your operations.
Ask follow up questions to explore further.
FEATURES
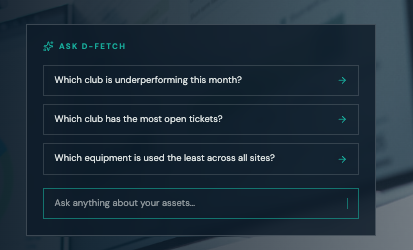
01 / Prompt instead of menus
Operations managers rarely have time to build reports. With D-Fetch AI-powered analytics you type the question as you would ask a colleague — and get the answer straight away, without knowing where the data lives in the platform.
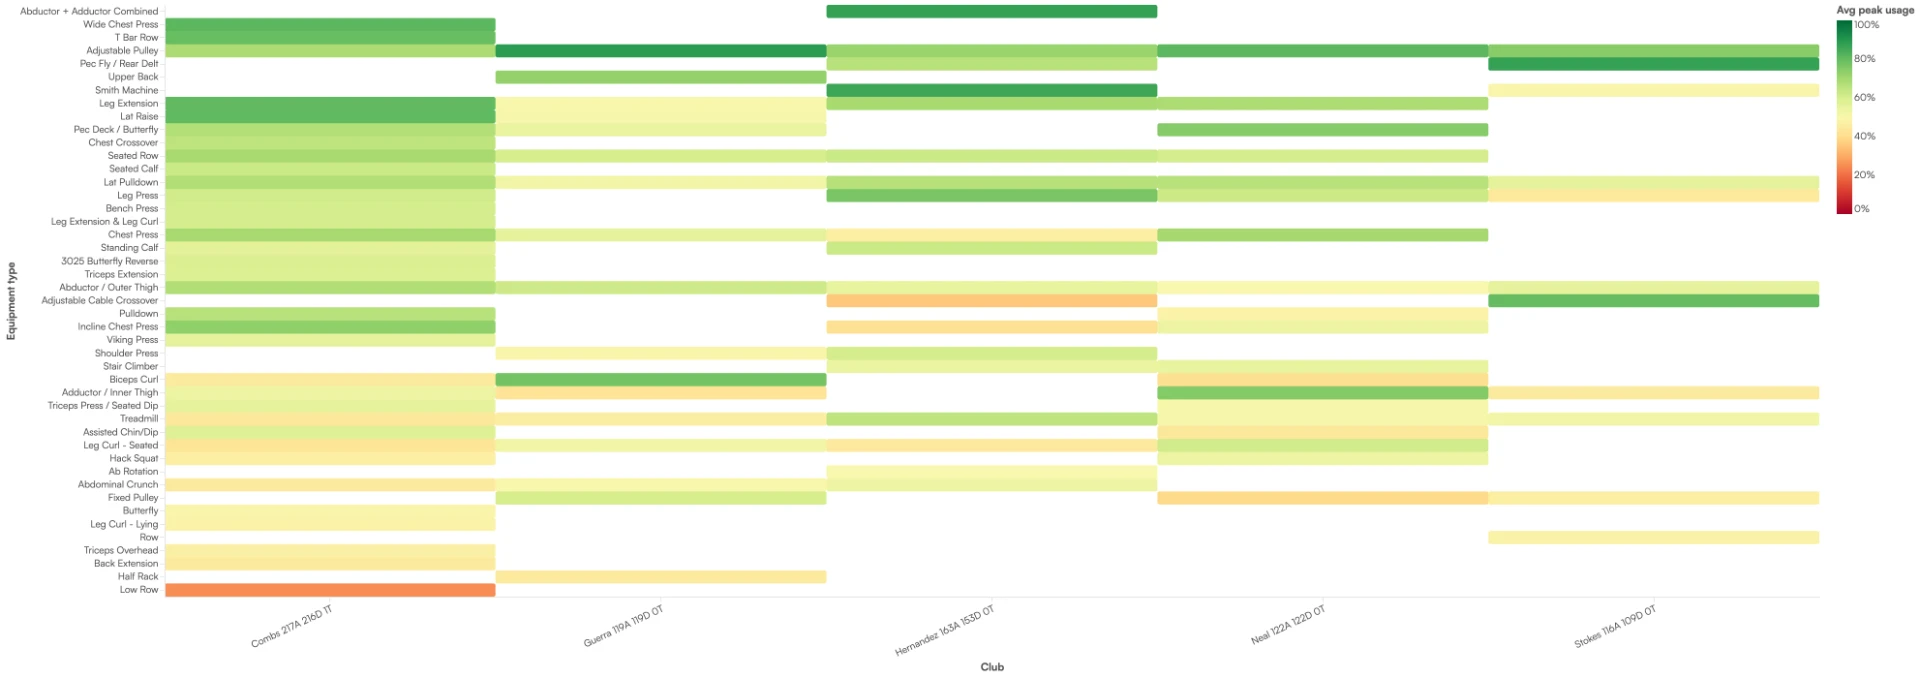
02 / Compare every site
Ask which club is underperforming, which has the most open tickets or where downtime is growing. AI-powered analytics compares every site in your portfolio and points you to the ones that stand out.
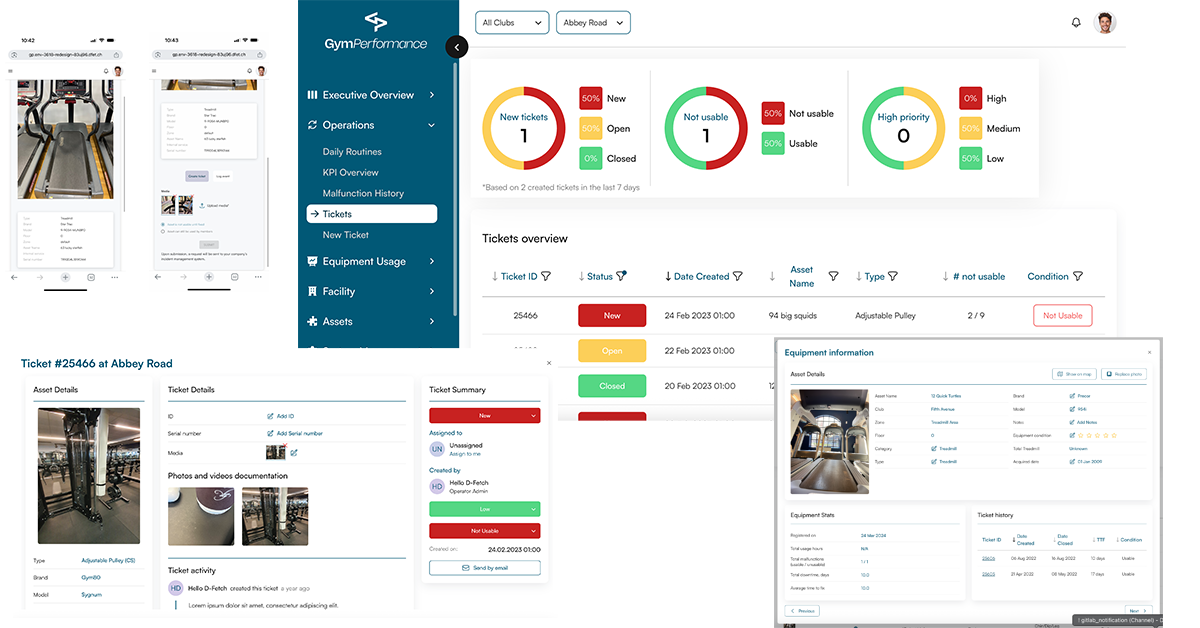
03 / Tickets and downtime
Because every ticket is tied to an asset, you can ask which equipment breaks most often, which brand causes the most downtime or how long repairs take per site — and get a clear answer instead of a spreadsheet.
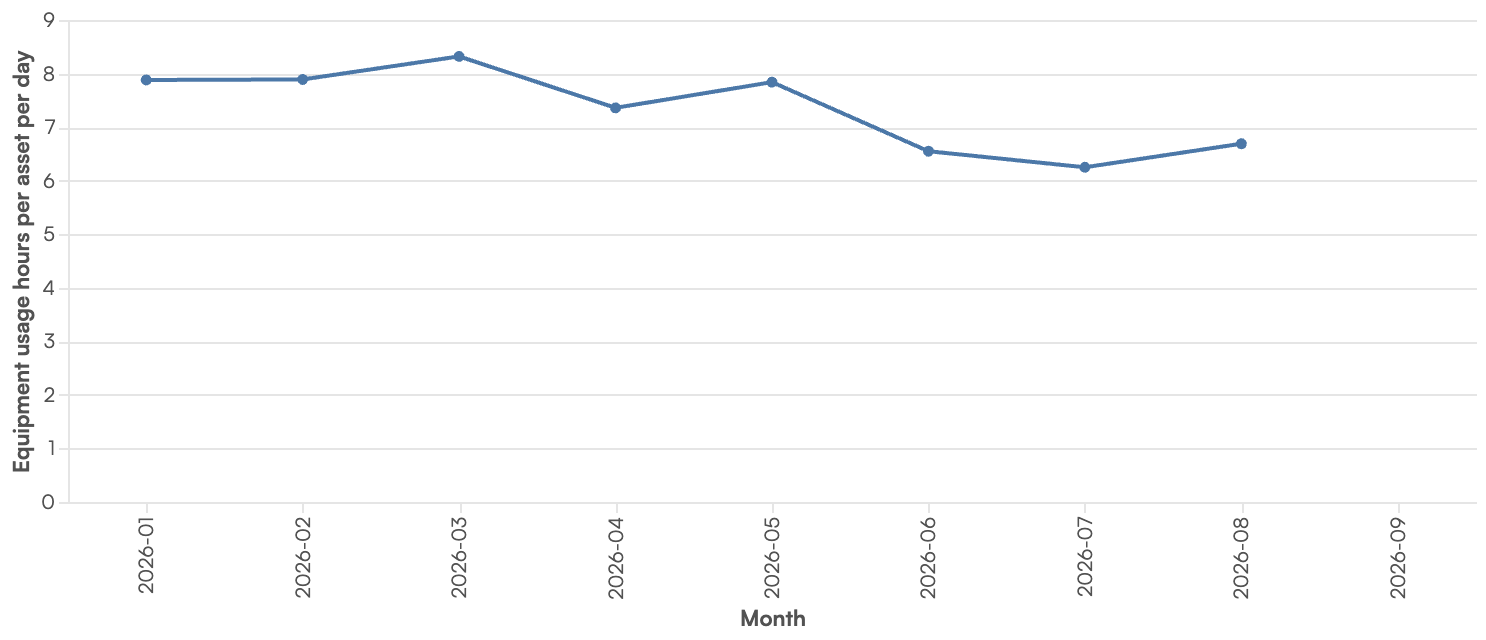
04 / Month-to-month comparison
Ask how this month compares to the last — downtime, open tickets, utilisation or completed routines — per club or across the whole portfolio. Trends become visible without exporting a single spreadsheet.
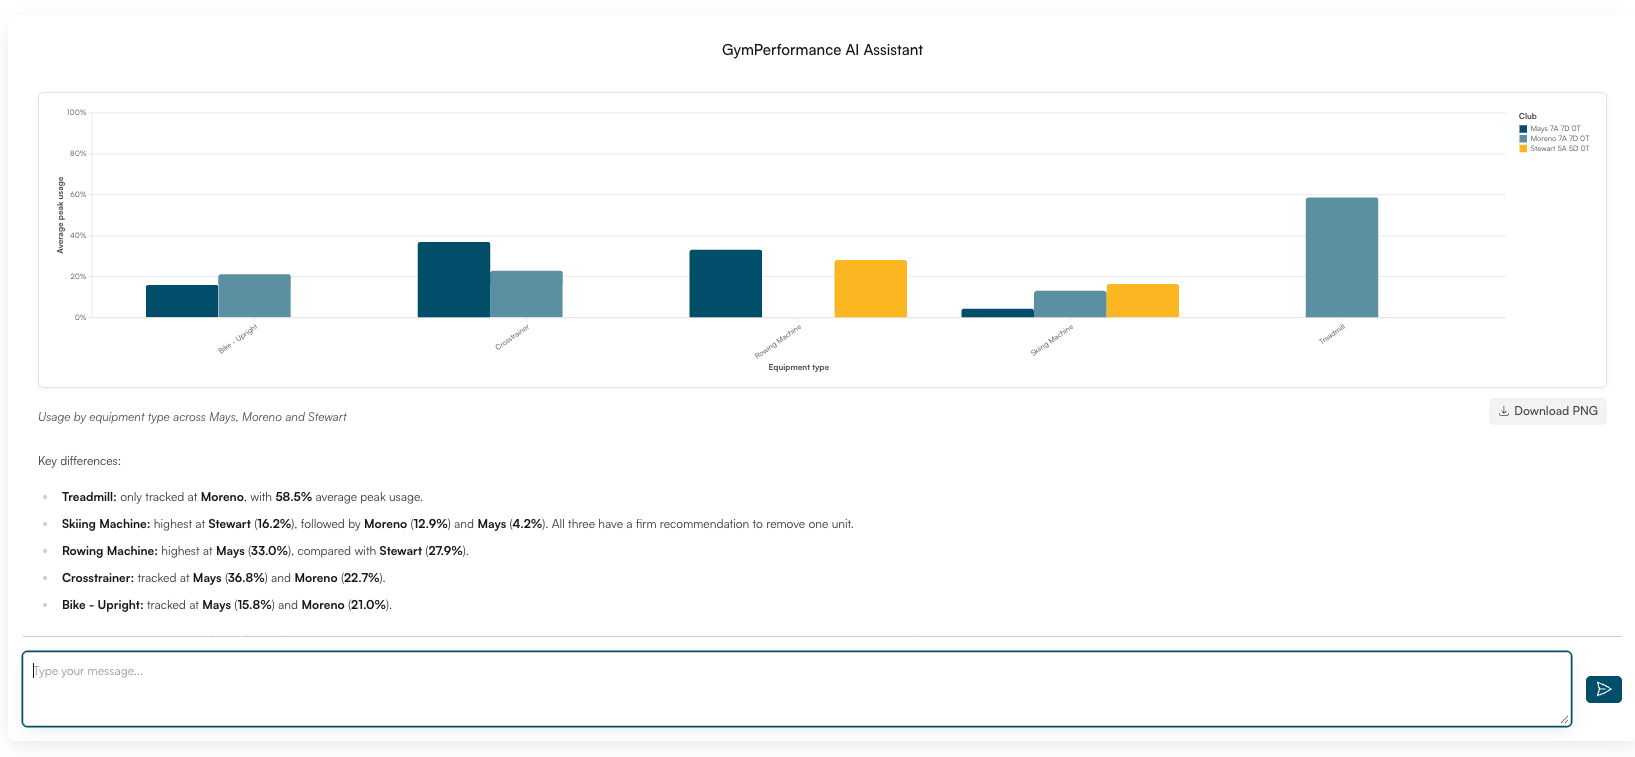
05 / Diagrams for reports
Ask for a chart and get one. AI-powered analytics turns the answer into a clear visual diagram you can use directly in management reports, board meetings or monthly reviews.
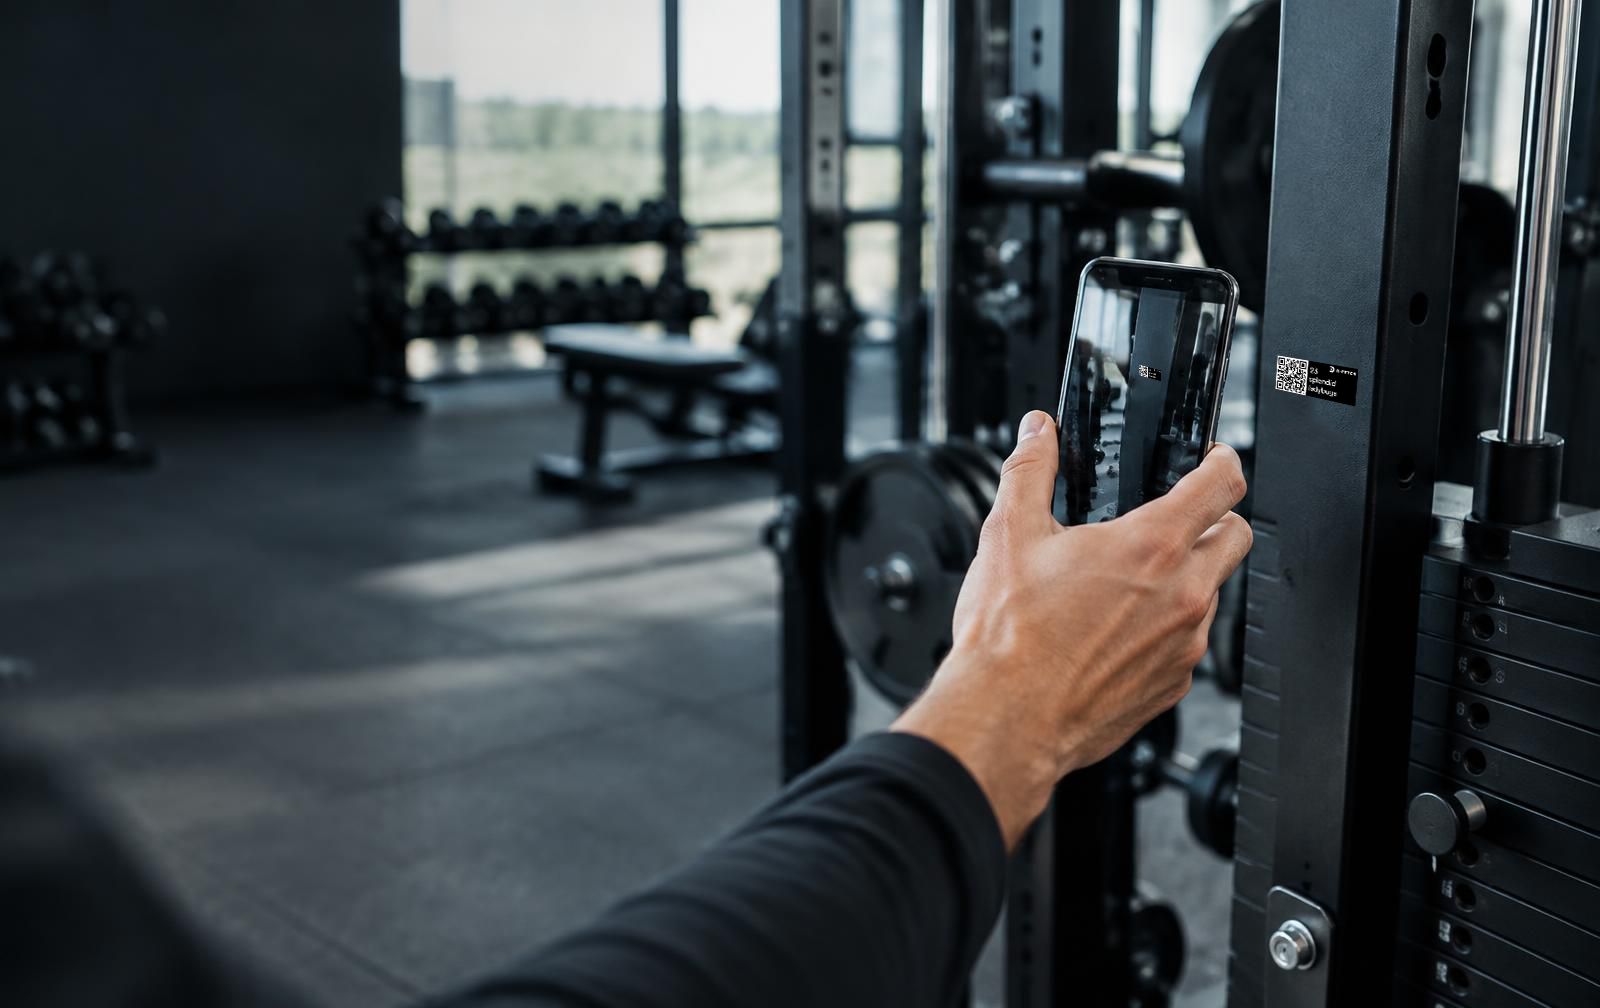
06 / AI Asset Recognition
Register equipment in seconds. Take a picture and AI compares it to hundreds of assets in our database, then identifies the type, brand and model automatically — no searching, no guesswork, just point, recognise and move on.
People & teams
Compare performance across your sites and ask where attention is needed.
Get quick answers about faults, equipment usage and daily routines at your site.
Ask about recurring faults and service history to prioritise maintenance and plan your next visit.
Get insights from usage and operational data across your sites to increase productivity, guide investments and improve profitability.
Explore more
Register physical assets with a photo and a QR code, and track their full lifecycle.
Every report, repair and conversation in one system, tied to the asset.
See how equipment is actually used, in real time.
Standardise daily tasks and checks across every site.
See how AI-powered analytics answers real questions about your own sites and equipment.