
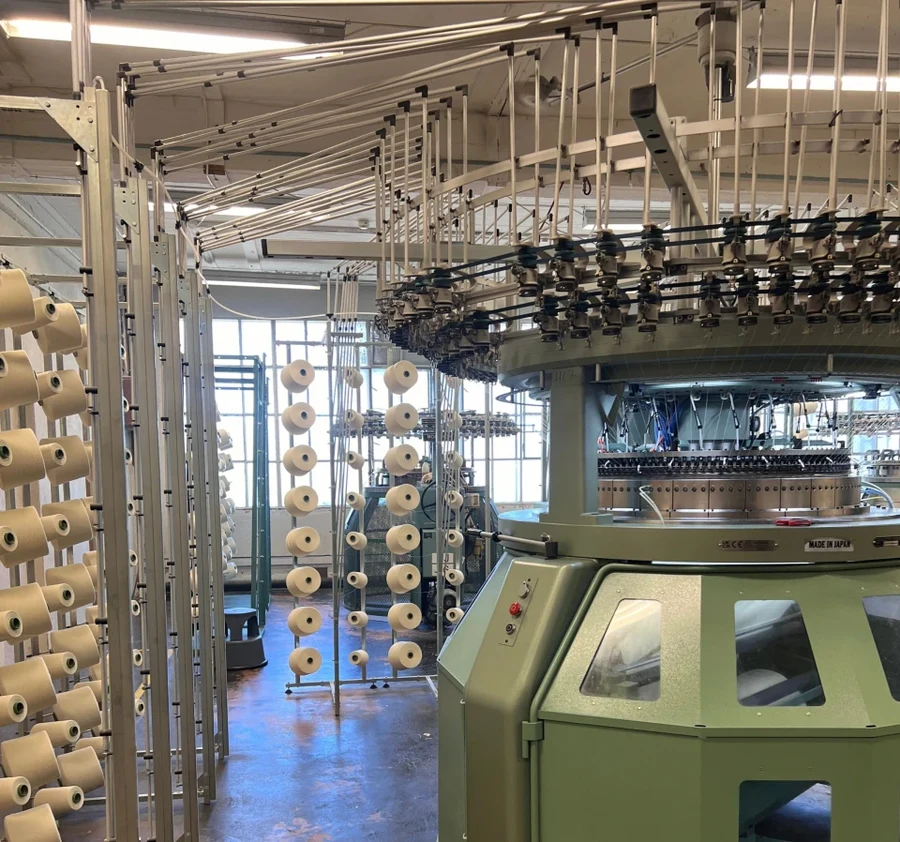
Production Productivity System
Turn unmeasured equipment stops into direct bottom-line EBITDA.
Production Productivity System uses sensors fitted to equipment to detect stops and calculate downtime and productivity. Sensors capture running and stopped time; operators classify stop causes. This is distinct from Line Production Performance, which uses QR-labelled equipment for line planning, modules and ticket reporting.
How it works
Modern factories rarely lose an entire shift to one catastrophic breakdown; capacity disappears in hundreds of unrecorded micro-stops (thread breaks, jams, cleaning, adjustments). Because fixed plant overhead is sunk, every recovered minute of uptime produces near-100% margin output. Wireless sensors attached in 30 minutes, feeding live shift and equipment benchmarking.
Key capabilities
- Non-invasive retrofit onto equipment of any vintage without stoppage
- One-touch operator stop cause categorization (jams, changeover, yarn break)
- Shift-by-shift availability and line balance benchmarking
- Automated calculation of lost minutes
- Andon live floor visualizer for line mechanics and team leaders
Specifications
- Deployment Speed
- 30 mins per asset; zero PLC touch
- Data Capture
- Vibration and motion telemetry
- Integration
- REST API, MQTT JSON, ERP/MES export
- Interface
- Operator tablet, mobile, Andon wallboard
- ROI Baseline
- 15–20% capacity unlock; €0 equipment Capex
Built for
- Chief Operating Officer
- Plant & Production Managers
- LEAN / Continuous Improvement Leaders
Inside the product
Screenshots from a live production environment
01
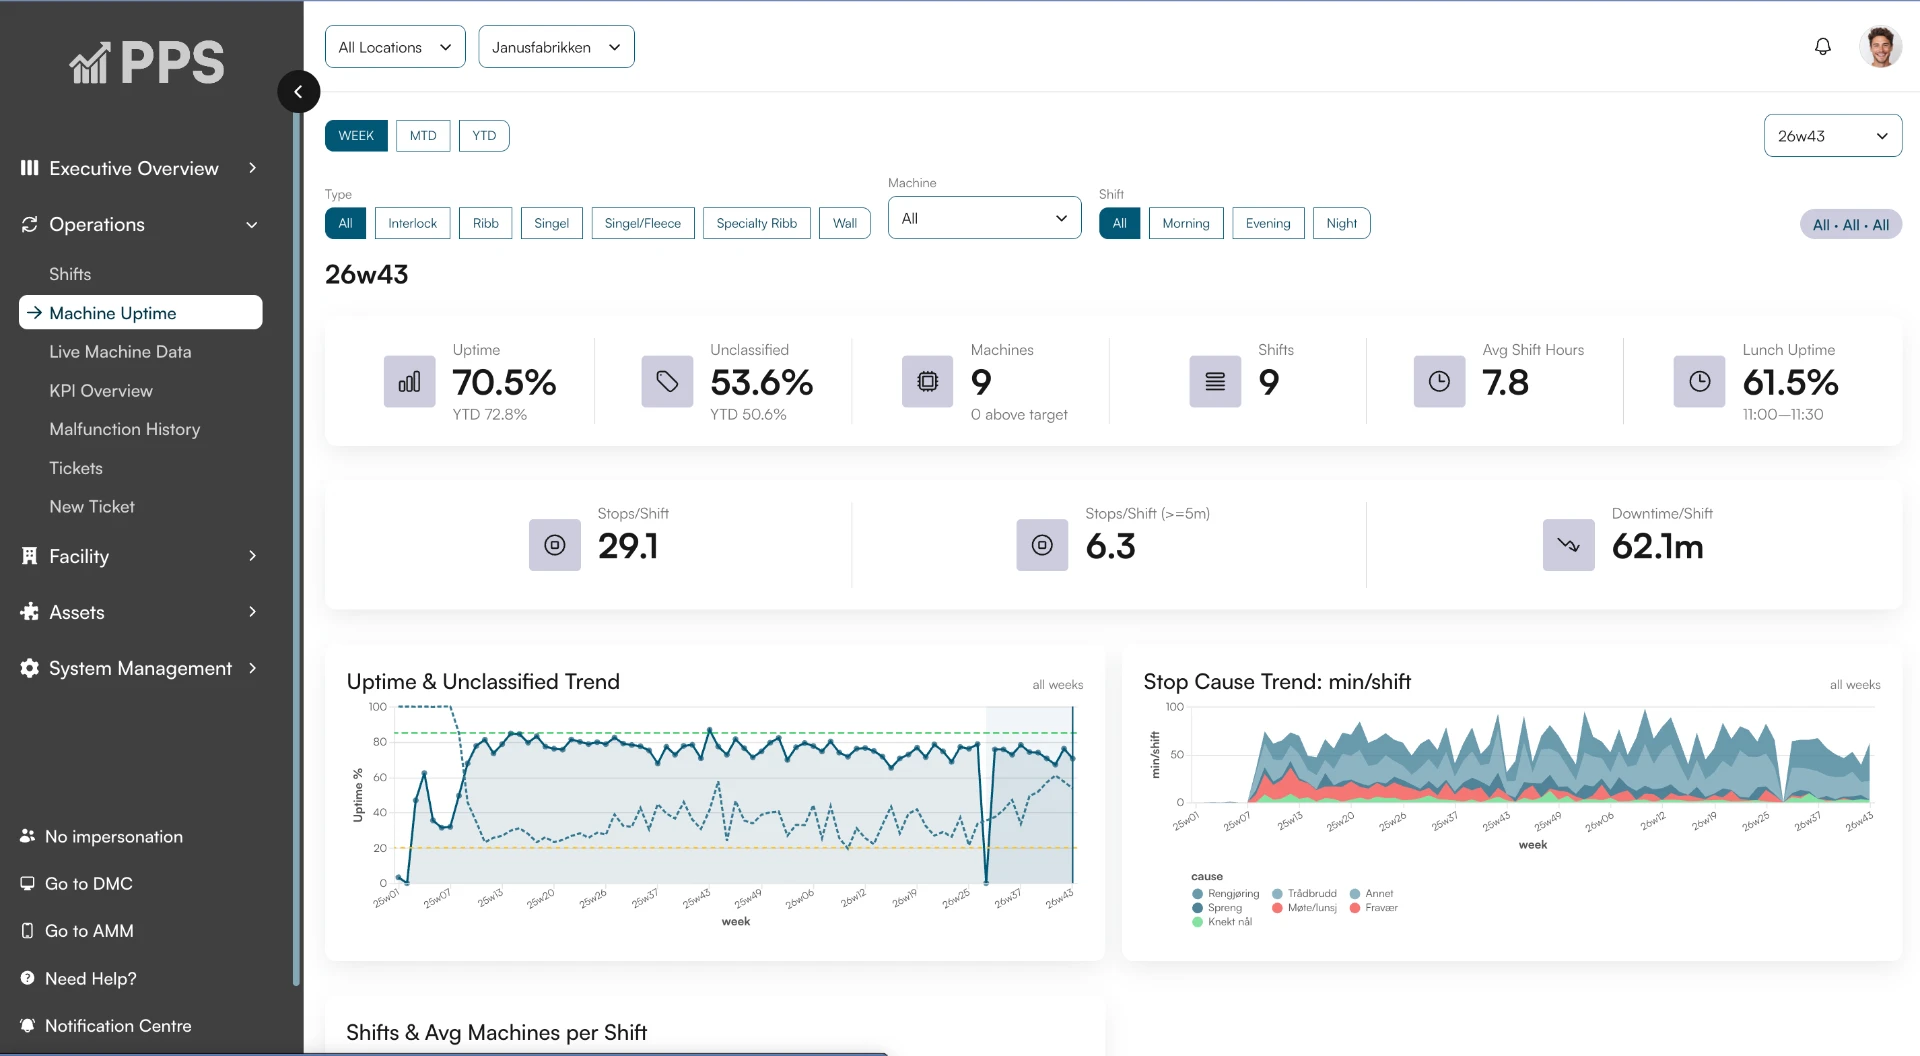
Uptime at a glance
One dashboard per week, shift or year: uptime, unclassified time, stops per shift and downtime, broken down by equipment type, shift and location. Trends show whether availability is improving.
02
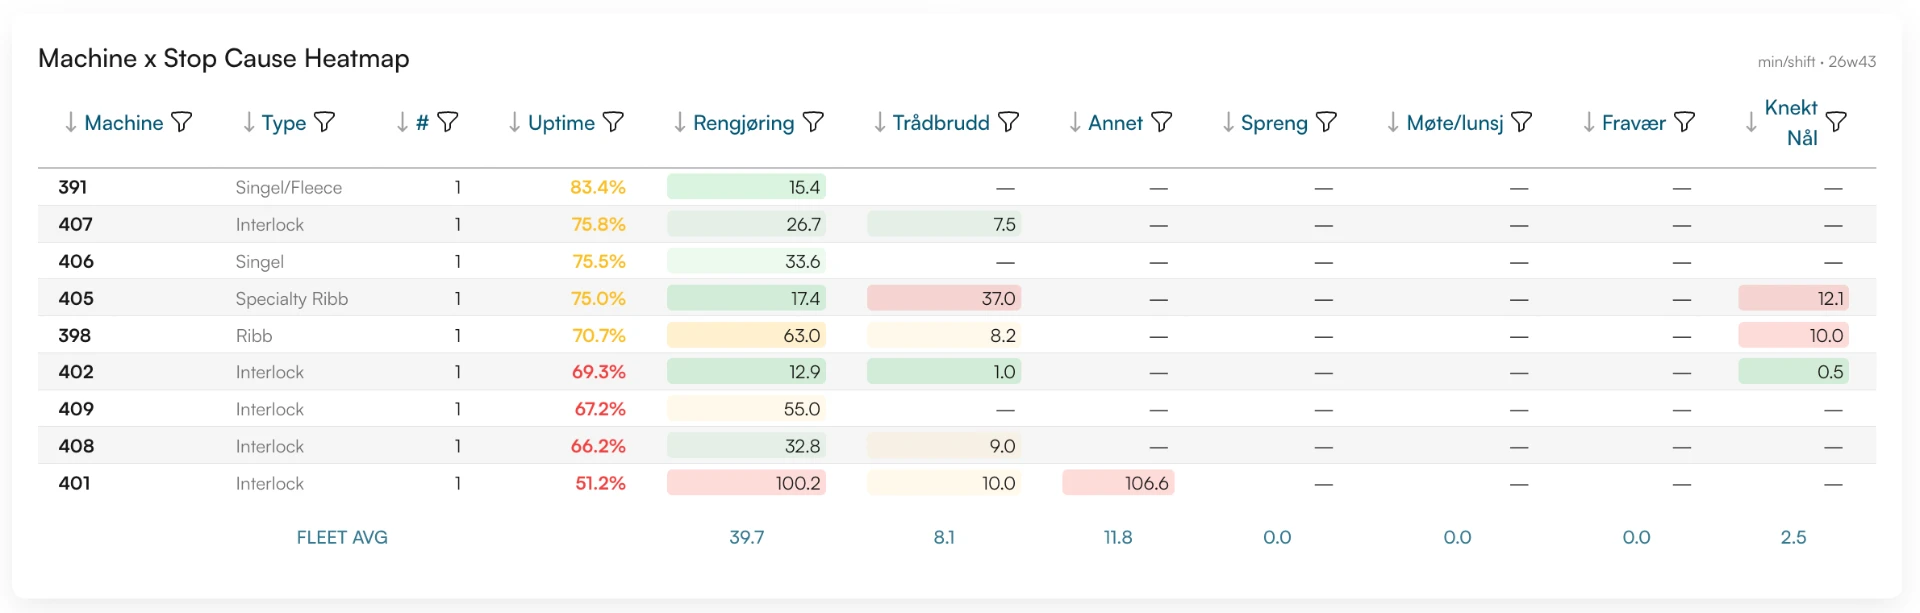
Every stop cause, per asset
A heatmap comparing each asset's stop causes — cleaning, yarn breaks, breaks, meetings, absence — against the fleet average, so the outliers and the recurring problems are impossible to miss.
03
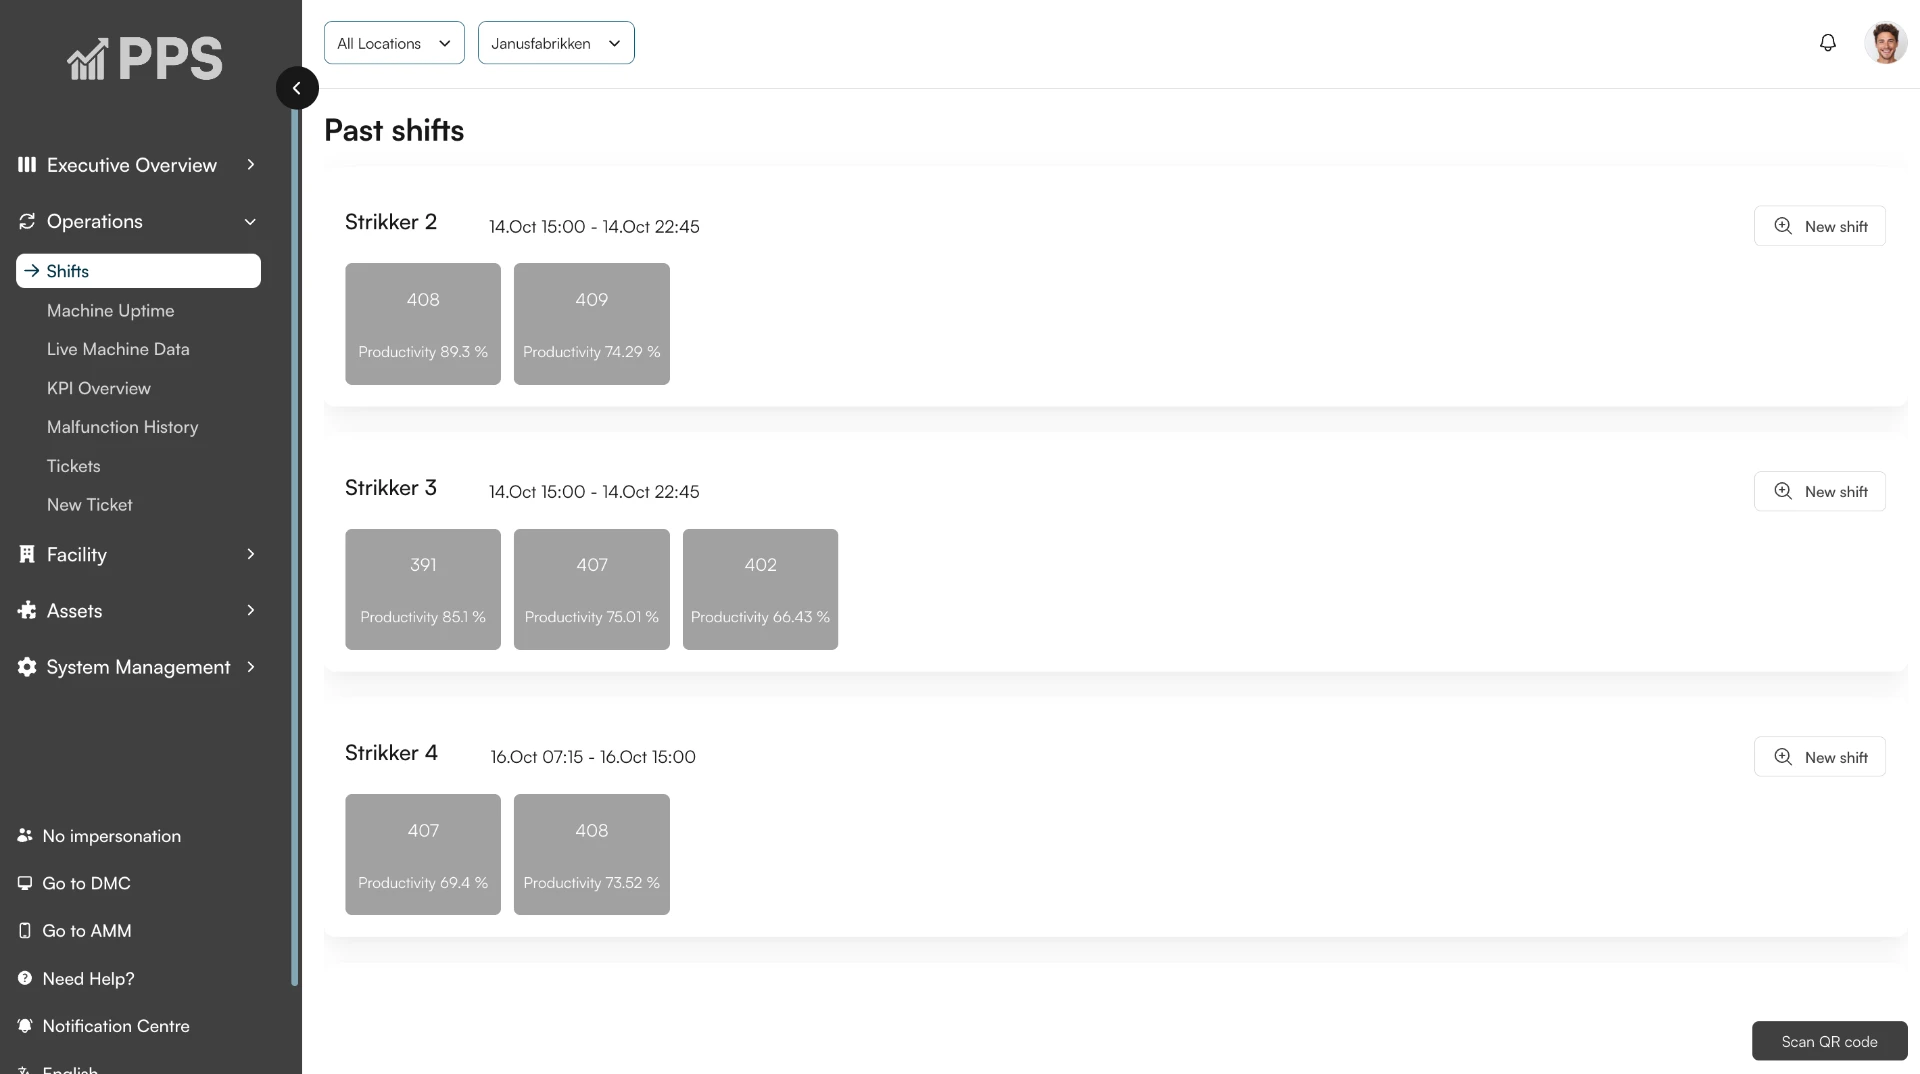
Shift reporting that writes itself
Past shifts show productivity per asset and per group, captured automatically from sensor data — no manual logging, no end-of-shift paperwork.
Proof in the field
Janus Fabrikker (Espeland, Norway) instrumented three key circular knitting machines in 2 hours, pinpointing recurring micro-stops accounting for 14% lost shift capacity.